
The Financial Challenge of Industrial Spares
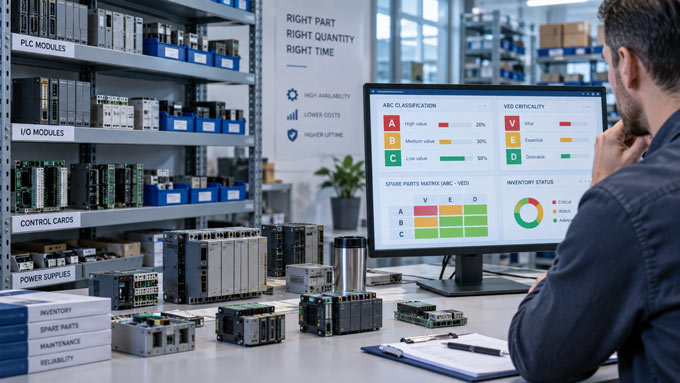
Plant management constantly struggles to balance two competing operational metrics: minimizing capital tied up in slow-moving warehouse inventory, while eliminating single-point-of-failure line stoppages. Applying an integrated ABC-VED (Vital, Essential, Desirable) classification matrix resolves this conflict.
 +──────────────────────────────────────────────────────+
       |               THE ABC-VED SPARE PARTS MATRIX         |
       |                                                      |
       |           Vital (V)      Essential (E)  Desirable (D)|
       |        +───────────────+──────────────+─────────────+|
       | High(A)| Class 1: CRIT | Class 2: MID | Class 3: LOW||
       | Med (B)| Class 1: CRIT | Class 2: MID | Class 3: LOW||
       | Low (C)| Class 2: MID  | Class 3: LOW | Class 3: LOW||
       +──────────────────────────────────────────────────────+
Analytical Breakdown
1. ABC Analysis (Annual Consumption Value)
- Class A: High-cost items representing 70% of total spare parts valuation (e.g., Main DCS CPU Racks, Safety Processors).
- Class B: Moderate-cost modules representing 20% of inventory value (e.g., Specialized Ethernet Gateways, High-Density Analog Output cards).
- Class C: Low-cost components accounting for 10% of value (e.g., Terminal blocks, relays, fuses).
2. VED Analysis (Criticality to Process Continuity)
- Vital (V): Failure leads to immediate, total plant trip; zero operational workarounds; lead time > 12 weeks.
- Essential (E): Causes severe capacity loss or loss of redundancy; manual control bypass possible for maximum 24 hours.
- Desirable (D): Cosmetic, secondary monitoring, or local display modules; plant operates safely without disruption.
Calculating Dynamic Safety Stock (SS)
For modules designated as Class 1 (Vital / High-Med Cost), calculate required spare counts with the following formula:
SS = Z \times \sqrt{\bar{L} \times \sigma_D^2 + \bar{D}^2 \times \sigma_L^2}
Where:
- Z: Service factor corresponding to acceptable stockout risk (e.g., Z = 2.33 for 99% availability).
- \bar{L}: Average procurement lead time (in months).
- \sigma_L: Standard deviation of supplier lead time (critical for discontinued EOL items).
- \bar{D}: Average demand/failure rate per period.
- \sigma_D: Standard deviation of failure rate.
Strategic Outcome
Categorizing legacy inventory prevents budget waste on non-essential parts, while guaranteeing that long-lead-time processors and power units are physically secured on site before unexpected line failures occur.